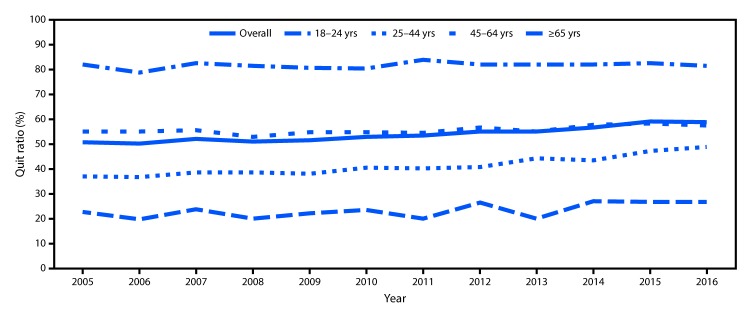
FIGURE 2.
Quit ratios* among ever smokers† aged ≥18 years, overall and by age group — National Health Interview Survey, United States, 2005–2016§
* Quit ratios defined as the ratio of former smokers to ever smokers for each survey year.
† Respondents aged ≥18 years who reported having smoked ≥100 cigarettes during their lifetime.
§ p-value for trend 2005–2016 adjusted for sex and race/ethnicity: overall: p<0.0001; 18–24 years: p = 0.0064; 25–44 years: p<0.0001; 45–64 years: p = 0.0002; ≥65 years: p = 0.0874.

