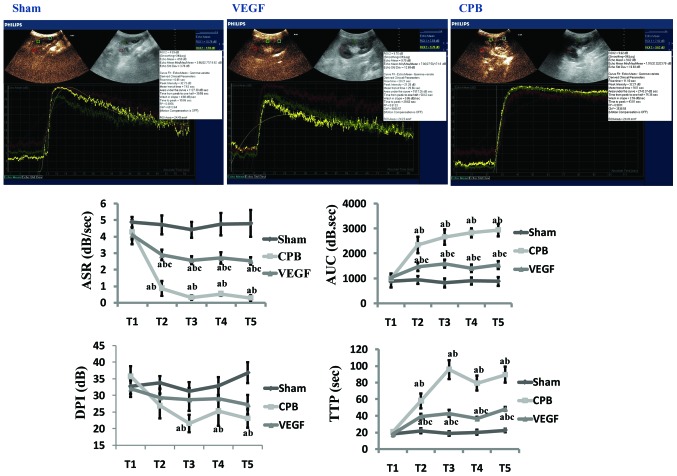
Figure 2.
Image of time-intensity curve 2 h after CPB (T5), and time-intensity curve parameter analysis (ASR, AUC, DPI, and TTP). aP<0.05 vs. sham; bP<0.05 vs. T1; cP<0.05 vs. CPB. CPB, cardiopulmonary bypass; VEGF, vascular endothelial growth factor; ASR, ascending slope rate; AUC, area under curve; DPI, peak intensity; TTP, time to peak intensity.

