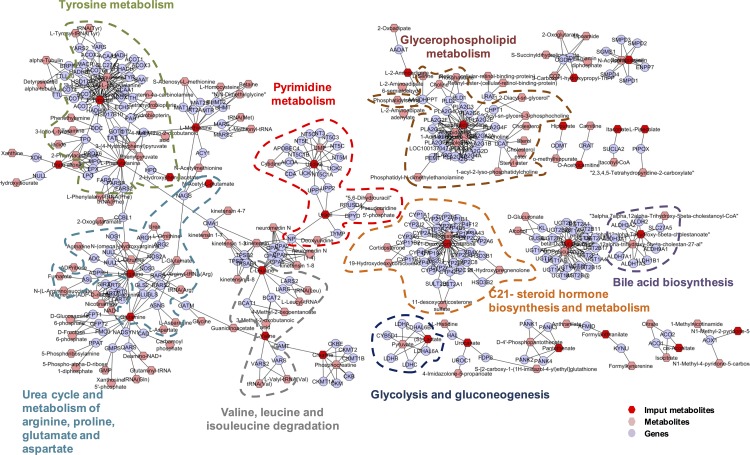
Figure 5.
Pathway-based network of differentially expressed metabolites in the subretinal fluid between CSCR and RRD. In the compound-gene networks, detected metabolites are shown in red. Blue nodes correspond to the genes identified by enrichment analysis performed using the differentially detected metabolites.

