Figure 4.

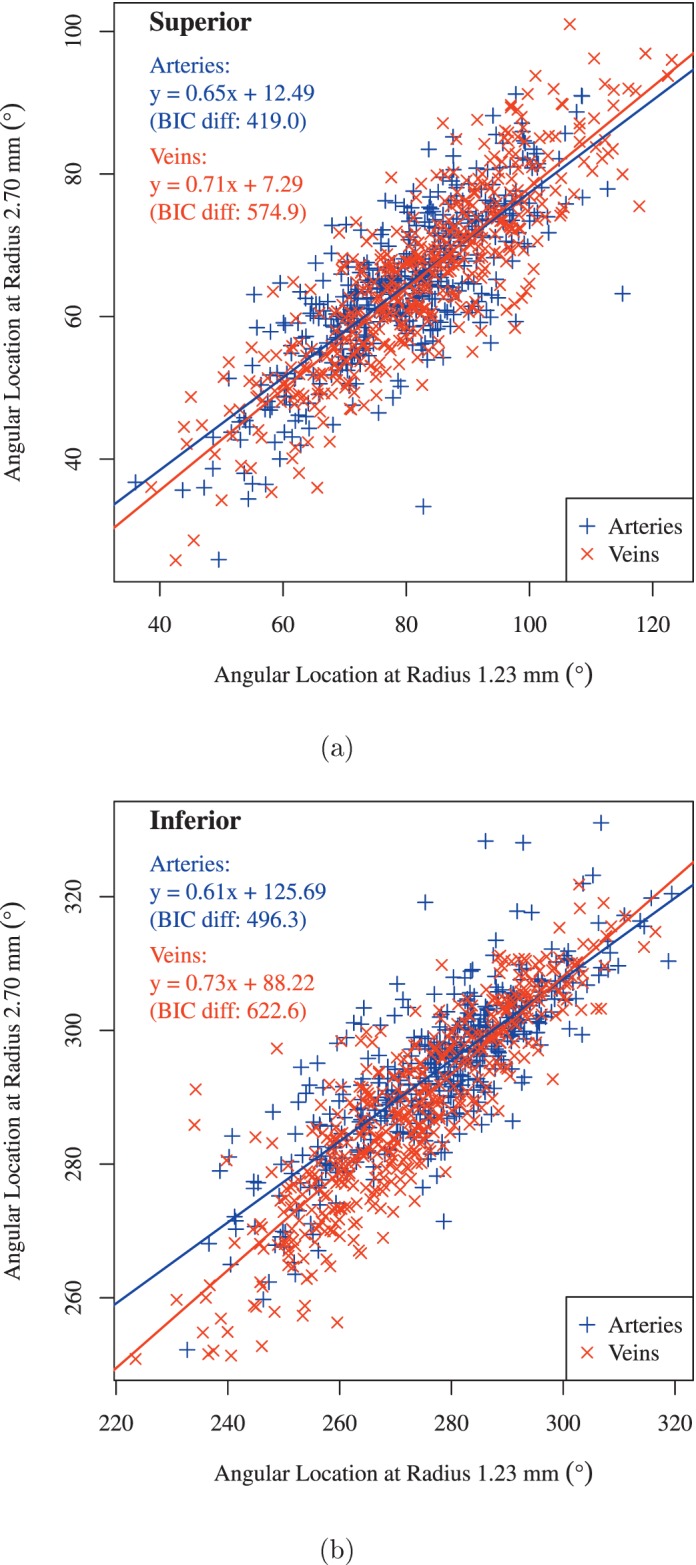
Linear regression of (a) superior and (b) inferior BV locations from the locations on the 1.23 mm circle to the locations on the 2.7 mm circle. Blue: arteries and red: veins. BIC Diff, difference of BIC.

Linear regression of (a) superior and (b) inferior BV locations from the locations on the 1.23 mm circle to the locations on the 2.7 mm circle. Blue: arteries and red: veins. BIC Diff, difference of BIC.