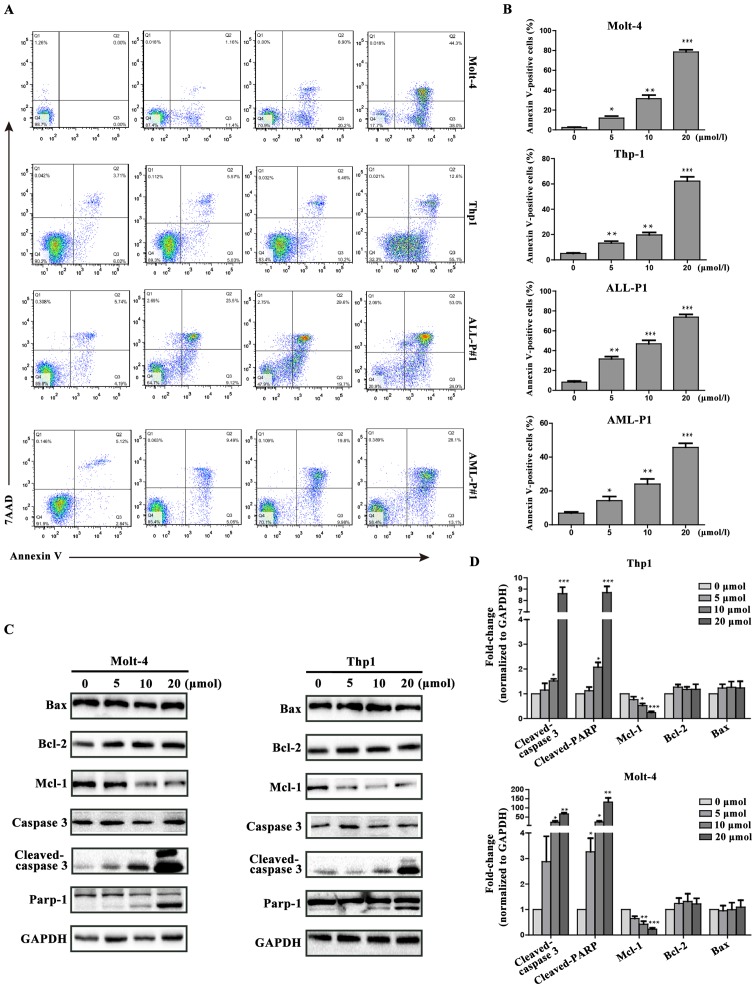
Figure 4.
Loperamide induces apoptosis in leukemia cell lines and primary leukemia cells from patients in a concentration-dependent manner. (A) Molt-4, Thp1, ALL-P1 and AML-P1 cells were treated with various concentrations of loperamide for 24 h and apoptosis was determined by flow cytometry. (B) The percentage of cell apoptosis following treatment with loperamide. (C) Western blot analysis of caspase-3, cleaved-caspase-3, PARP, Bcl-2, Bax and Mcl-1 in Molt-4 and Thp1 cells treated with loperamide for 24 h. (D) Band quantification is shown as the fold change from control. The results are presented as the mean ± standard deviation of three independent experiments. *P<0.05; **P<0.01; ***P<0.001 vs. control group. PARP, poly(ADP-ribose) polymerase; Bcl-2, B-cell lymphoma-2; Bax, Bcl-2-associated X protein; Mcl-1, myeloid cell leukemia 1; acute lymphocytic leukemia-patient 1; AML-P1, acute myeloid leukemia-patient 1.

