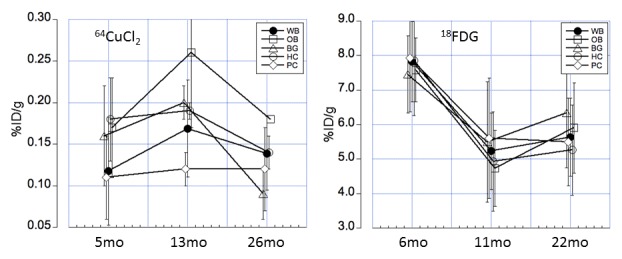
Figure 5. Correlative presentation of age-dependent changes of 64Cu uptake (left panel) and 18F-FDG uptake (right panel) determined using longitudinal PET analysis.

The figures demonstrate a significantly different time course of 64Cu and 18F-FDG uptake in the brain regions across the life span, indicating variable changes of copper fluxes and glucose metabolism in brain aging. Regions were shown for whole brain (WB), olfactory bulb (OB), basal ganglia (BG), posterior cortex (PC), and hippocampus (HC). Error bars represent SD; %ID/g, percentage of injected dose per gram tissue.
