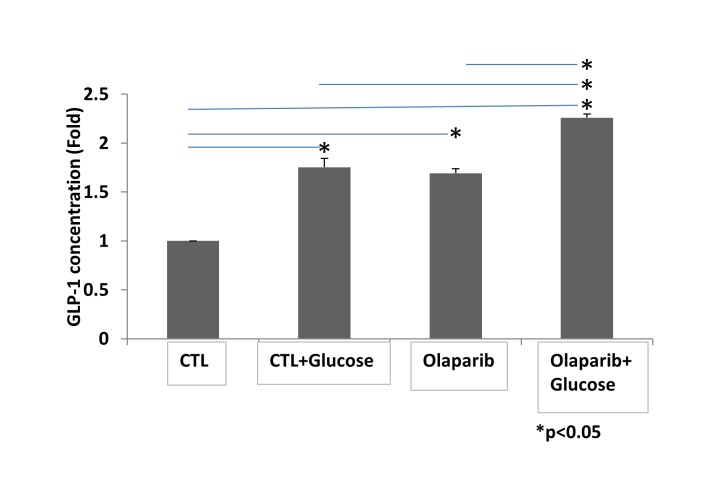
Figure 5. Olaparib enhances promotes GLP-1 secretion in NCI-H716 cells.
Cells were stimulated for 30 minutes with or without 16 mM glucose. GLP-1 was measured by ELISA. Bars represent the mean of three independent experiments normalized to the control. Error bars indicate standard deviation. Statistical analyses were performed by two-tailed Student’s t-test and significance is denoted by asterisks where *P<0.05.

