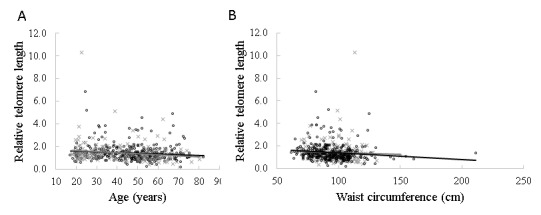
Figure 1. Correlation of relative telomere length with age and waist circumference.

Scatter plots showing the correlation of age (A) and waist circumference (B) with the relative telomere length of peripheral leucocyte blood respectively in males and females. The grey line and (×) represent the males (n=178) and the black line and (o) represent the females (n=319). The P-values were calculated from the linear regression analyses of the relationships between age, waist circumference and RTL in males and females, and the Pearson correlation was used.
