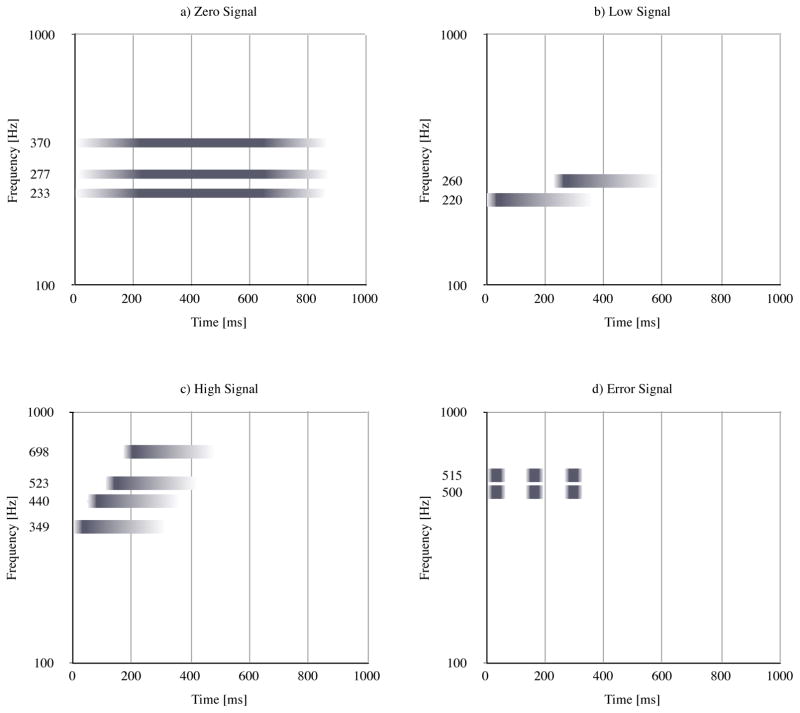
Fig. 4.
Profile of the auditory display tones, where frequency of individual oscillators is shown on the y-axis, playback time from 0 to 1000 ms on the x-axis. Amplitude envelope is depicted using a gradient from white to dark gray. The zero signal tone employs sine oscillators, and the remaining tones employ triangle oscillators. a) Zero signal, b) low signal, c) high signal, d) error signal

