
Figure 1.
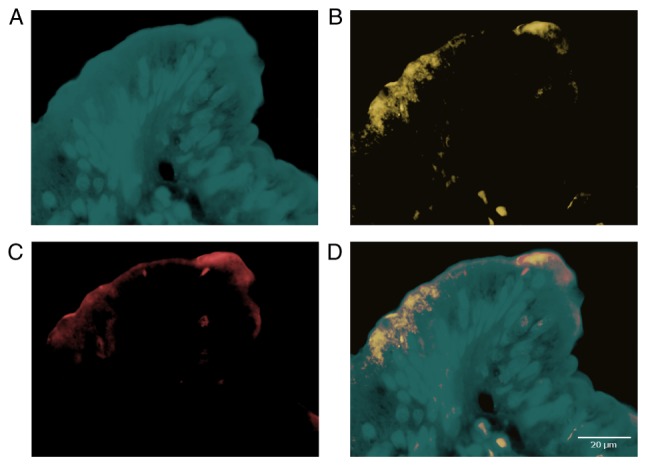
Representative immunofluorescence images of the colorectal cancer cells showing expression of activated PDK1, AKT and total PTEN expression in separated (A, B, C respectively) and combined (D) fluorescence channels. Note primarily submembrane location of the markers (less then 10 µm from the cell membrane).