
Figure 10.
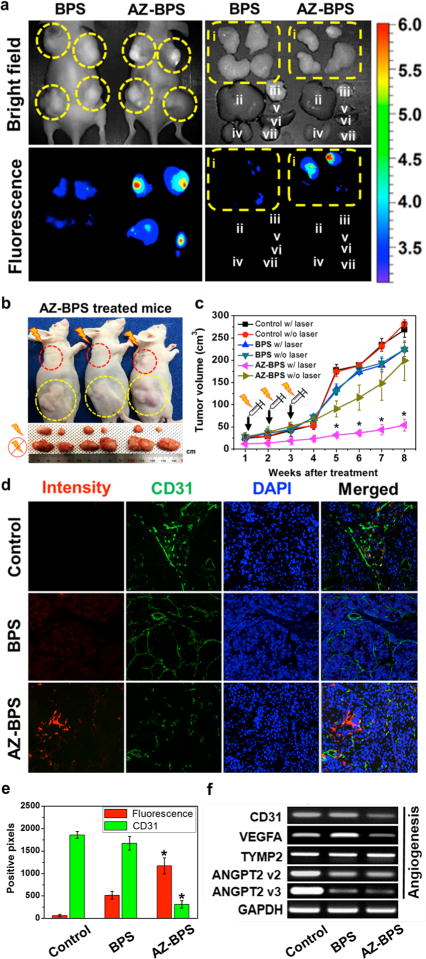
In vivo diagnostic and photocytotoxic effects of BPS. (a) (Left) In vivo images of nude mice 3 h after tail intravenous injection of BPS or AZ-BPS. (Right) Ex vivo images of various organs (i, tumor (yellow circle); ii, liver; iii, lung; iv, kidney; v, heart; vi, spleen; vii, testis) taken from nude mice 6 h after intravenous tail vein injection of BPS or AZ-BPS. (b) (Top) Representative images of nude mice 8 weeks after intravenous tail vein injection of AZ-BPS followed by 660 nm laser irradiation (2.0 W/cm2, 30 min; 3600 J/cm2) of the upper tumor (red circle). The lower tumor (yellow circle) was used as a nonirradiated control. (Bottom) Dissected tumors from each group. (c) Tumor volume of the mice in the BPS or AZ-BPS groups with or without PDT treatment. (d) Fluorescence-based determination of neoangiogenesis in the tumor tissues. Note that significantly decreased CD31-postive pixel area in the tumor tissues of AZ-BPS injected mice with 660 nm laser irradiation (2.0 W/cm2, 30 min; 3600 J/cm2), compared to those of the PBS control and BPS-injected groups. *P < 0.05. Magnification 100×. (e) Bar graph showing extent of neoangiogenesis in the tumor tissues. (f) Expression levels of genes associated with angiogenesis. MDA-MB-231 cells were treated 5 μM of AZ-BPS or BPS for 4 h and collected 6 h after subjecting to 660 nm laser irradiation (2.0 W/cm2, 30 min; 3600 J/cm2). Gene expression was determined by RT-PCR.