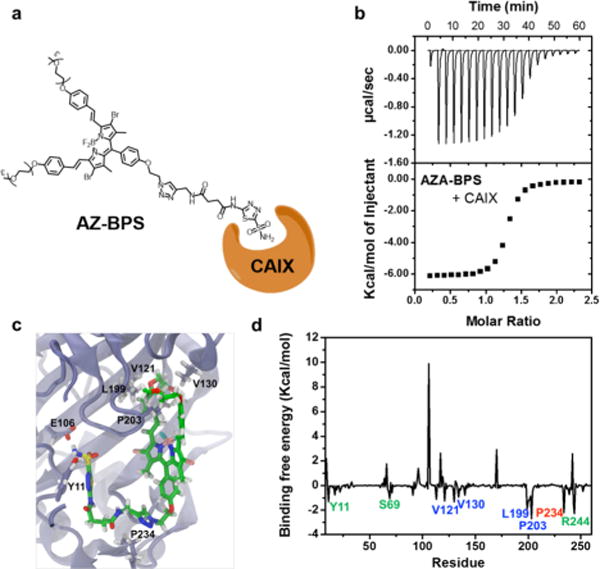
Figure 5.

Binding study of AZ-BPS with CAIX. (a) Schematic diagram showing binding of AZ-BPS with CAIX’s active site. (b) Isothermal titration curve for binding interaction of AZ-BPS with CAIX in a 10% DMSO buffer solution (pH 7.4, 10 mM aqueous PBS) (KD = 2.94 ± 0.24 μM; N = 1.27 ± 0.01 sites; ΔH = −6.19 ± 0.03 kcal/mol). (c) Calculated binding site and (d) deconvoluted binding free energy corresponding to the interaction between AZ-BPS and CAIX.
