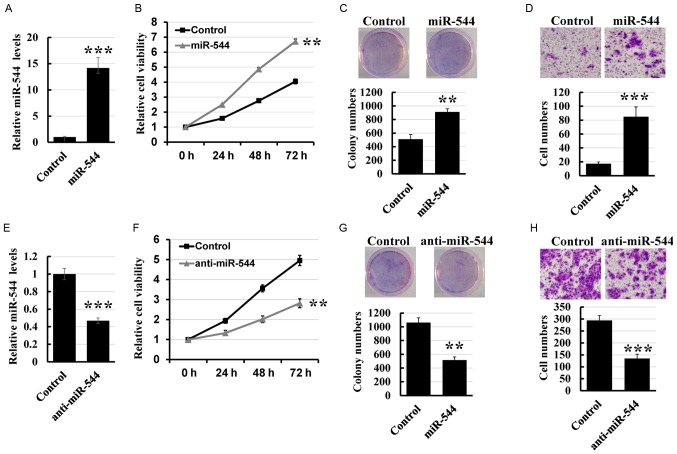
Figure 2.
miR-544 promotes colorectal cancer progression. (A) Expression levels of miR-544 in HT29 cells transfected with miR-544 mimic determined using RT-qPCR. (B) MTT analysis of miR-544-overexpressed HT29 and control cells. (C) Colony formation assay of miR-544-overexpressed HT29 and control cells. (D) Transwell assay of miR-544-overexpressed HT29 and control cells (magnification, ×400). (E) Expression levels of miR-544 in HCT116 cells transfected with miR-544 inhibitor determined using RT-qPCR. (F) MTT analysis of miR-544-depleted HCT116 and control cells. (G) Colony formation assay of miR-544-depleted HCT116 and control cells. (H) Transwell assay of miR-544-depleted HCT116 and control cells (magnification, ×400). **P<0.01, ***P<0.001 vs. control. miR, microRNA; RT-qPCR, reverse transcription-quantitative polymerase chain reaction.

