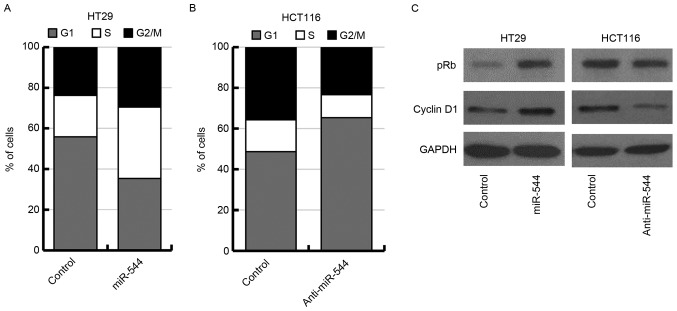
Figure 3.
miR-544 induces G1 to S phase transition. Flow cytometric analysis of (A) miR-544-overexpressed HT29, (B) miR-544-depleted HCT116 and their control cells. (C) Western blot analysis of pRb and cyclin D1 expression levels in miR-544-overexpressed HT29 (left) and miR-544-depleted HCT116 (right), as well as their control cells. miR, microRNA; pRb, phosphorylated retinoblastoma protein.

