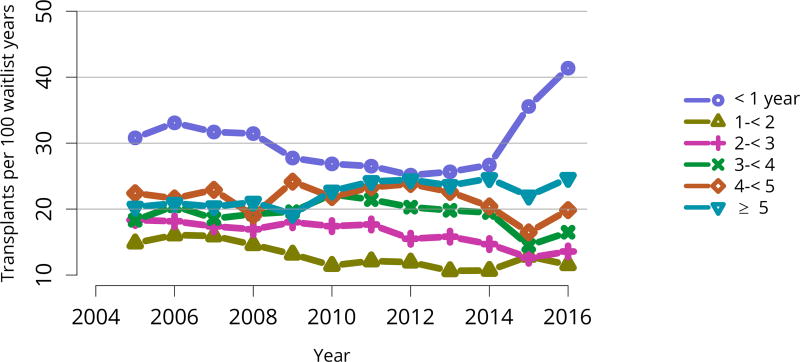
Figure KI 15. Deceased donor kidney transplant rates among active adult waitlist candidates by time on the waitlist.
Transplant rates are computed as the number of deceased donor transplants per 100 patient-years of active wait time in a given year. Individual listings are counted separately. Rates with less than 10 patient-years of exposure are not shown.

