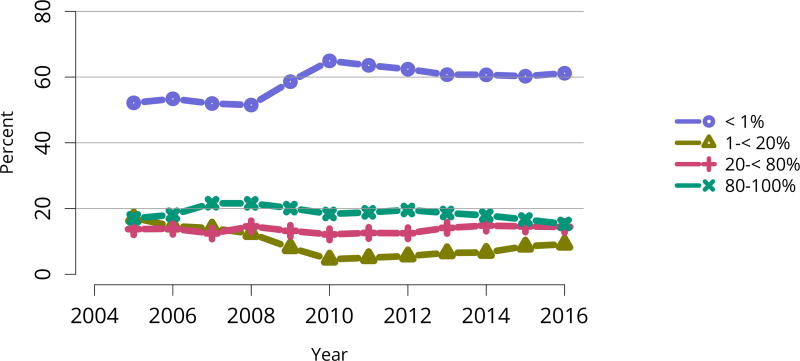
Figure KI 97. Distribution of pediatric candidates waiting for kidney transplant by C/PRA.
Candidates waiting for transplant at any time in the given year. Candidates listed concurrently at multiple centers are counted once. From December 5, 2007, through September 30, 2009, CPRA was used if greater than 0; otherwise, the maximum pretransplant PRA was used. Before December 5, 2007, the maximum pretransplant PRA was used unconditionally. CPRA is used after September 30, 2009. C/PRA is the highest value during the year. Active and inactive candidates are included.

