Figure 3.
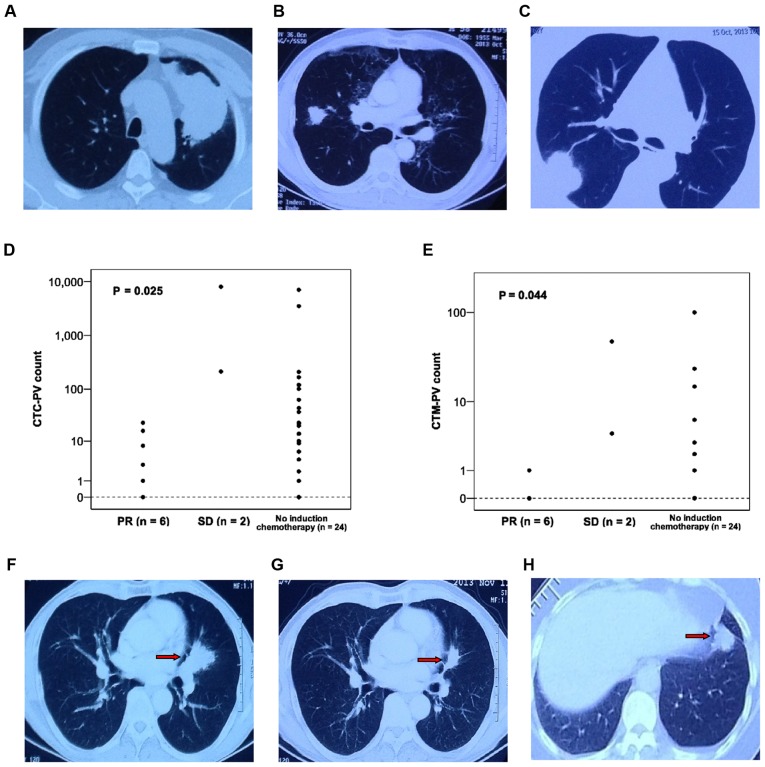
Patient computed tomography images and correlation between CTC/CTM counts and clinical variables. (A) The large tumor in the left upper lobe of the lung was 9.0 cm at its largest diameter and 3,500 CTCs and 24 CTM were detected/7.5 ml PV blood following lobectomy in this patient. (B) A patient with lung cancer and a 2.5 cm tumor in the right middle lobe of the lung was pathologically diagnosed with stage IA disease. However, the CTC-PV count was 120 and the CTM-PV count was 3. (C) The PV blood from a patient with stage IB disease and a 5.0 cm tumor contained no CTCs or CTM. Distribution of (D) CTC-PV and (E) CTM-PV according to response to neoadjuvant chemotherapy. (F) Tumor in the left upper lobe of another patient with lung cancer (red arrow). (G) The tumor achieved PR following 2 cycles of induction chemotherapy with gemcitabine plus cisplatin (red arrow). Although the pathological stage was IIIA, there were only 8 CTC-PV and no CTM in this patient. (H) Another patient with stage IA disease (2.0 cm tumor) without induction therapy had 23 CTC-PV and 2 CTM-PV (red arrow). CTC, circulating tumor cell; CTM, circulating tumor microemboli; PV, pulmonary vein; PR, partial response; SD, stable disease.

