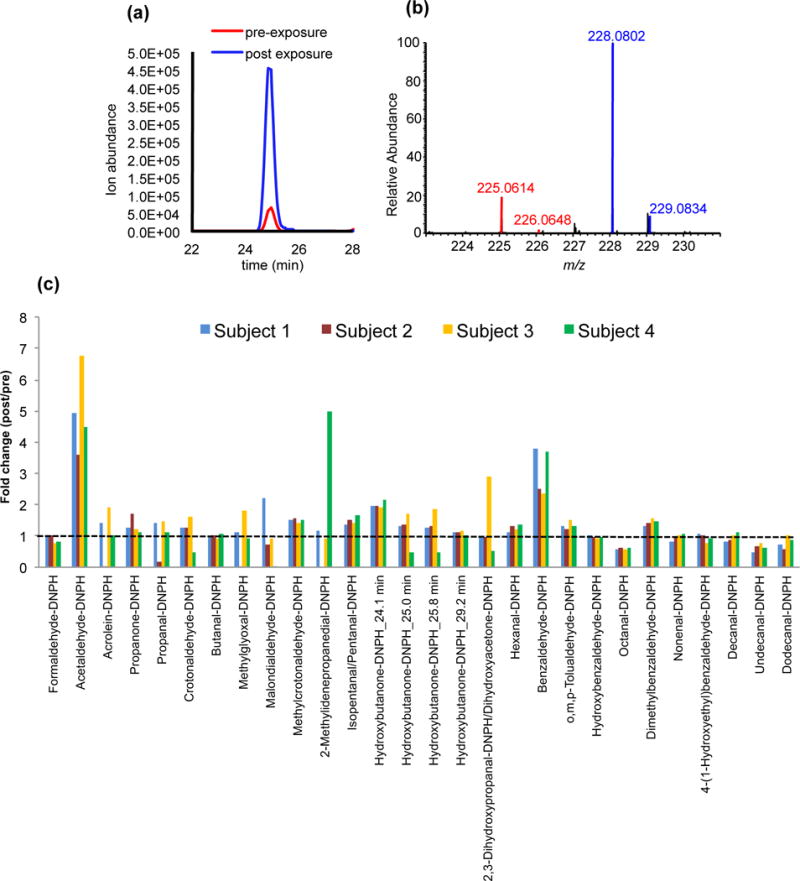
Figure 6.

(a) Representative extracted ion current (EIC) chromatograms and (b) MS spectrum of d0-labeled acetaldehyde (pre-exposure) and d3-labeled acetaldehyde (post-exposure) before and after alcohol exposure. (c) Quantitation of DNPH-derivatized carbonyls in saliva before and after alcohol exposure.
