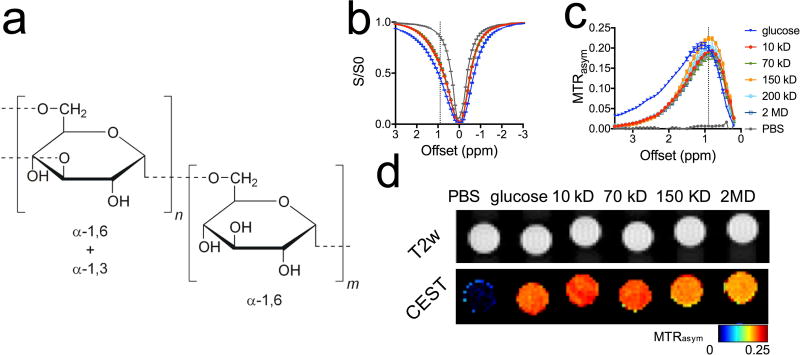
Figure 1. CEST MRI detection of dextrans.
a) Chemical structure of dextran. b) Z spectra. c) MTRasym plots. d) CEST parametric maps (quantified by MTRasym at 0.9 ppm) of PBS, 20 mM glucose, and dextrans of 10, 70, 150, and 2,000 KD (20 mM on a glucose unit basis). All samples were prepared at pH=7.3 in 10 mM PBS, and the CEST MRI was acquired using a 4-second long CW RF pulse (B1=3.6 µT) at 37 °C.

