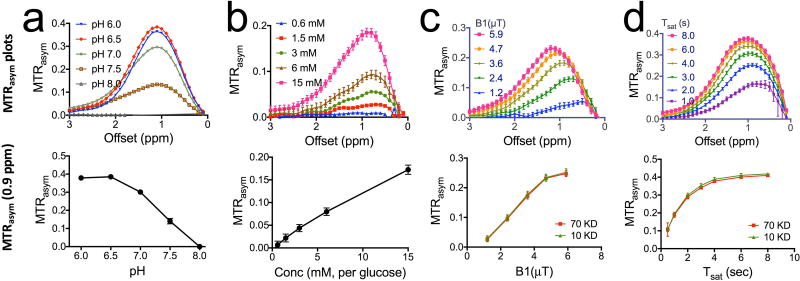
Figure 3. Characterization of CEST MRI signal for 70 kD dextran.
a) MTRasym plots of 20 mM D70 at different pH (top) and pH-dependence of dexCEST contrast quantified by MTRasym at 0.9 ppm (bottom). b) MTRasym plots of D70 at different concentrations (top) and concentration-dependence of dexCEST contrast quantified by MTRasym at 0.9 ppm (bottom). c) MTRasym plots of 20 mM D70 acquired using different B1 (top) and the B1-dependence of dexCEST contrast of both D10 and D70 as quantified by MTRasym at 0.9 ppm. d) MTRasym plots of 20 mM D70 acquired using different Tsat (top) and the Tsat- dependence of dexCEST contrast of both D10 and D70 as quantified by MTRasym at 0.9 ppm (bottom). Unless otherwise stated, all samples were prepared in 10 mM PBS pH=7.3, and the CEST MRI was acquired using a 4-second long CW RF pulse (B1=3.6 µT) at 37 °C.

