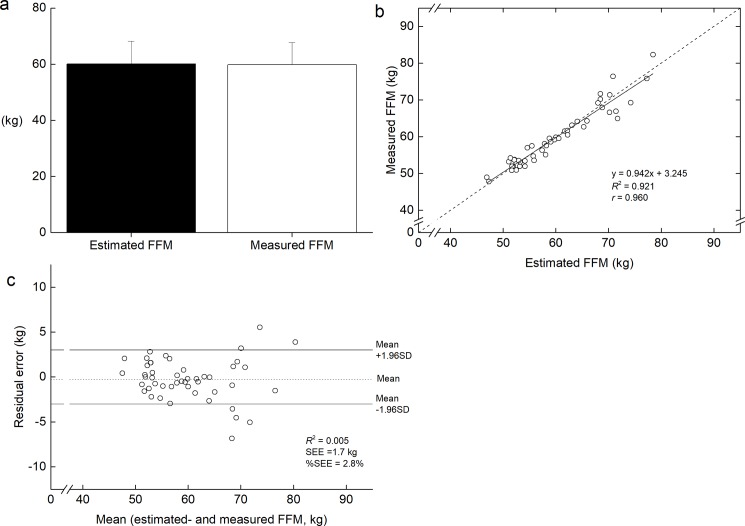
Fig 4.
Comparison the estimated whole-body fat-free mass (FFM) to the measured FFM in cross-validation group (a), and regression between the measured FFM and the estimated FFM (b), and residual vs. the mean values of the measured and estimated FFM values (c). In panel b, dotted line shows identical line. In panel c, dashed and solid lines indicate the mean values of residual errors and mean ± 1.96 SD, respectively.

