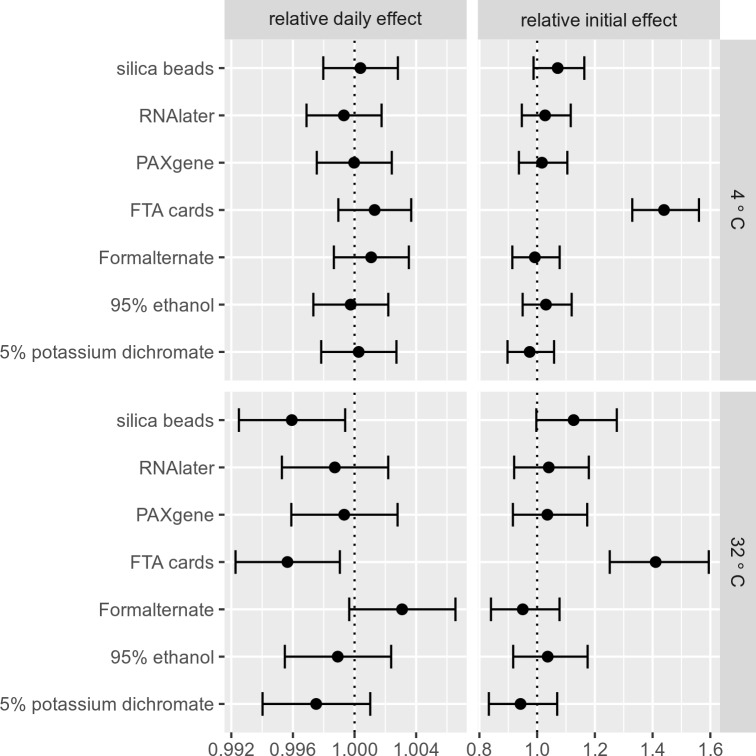
Fig 3. Estimates and confidence intervals for relative daily effects and relative initial effects for preservation methods at 4°C and 32°C.
The graph shows the relative daily effect and the relative initial effect for each preservation method relative to the control/”no preservative” (dashed line). 5% potassium dichromate, two-step silica bead method and FTA cards seem to perform marginally better than the absence of a preservative at 32°C.

