
Figure 1. Reprogramming of cell type-specific gene expression into iPSC-specific transcriptional program.
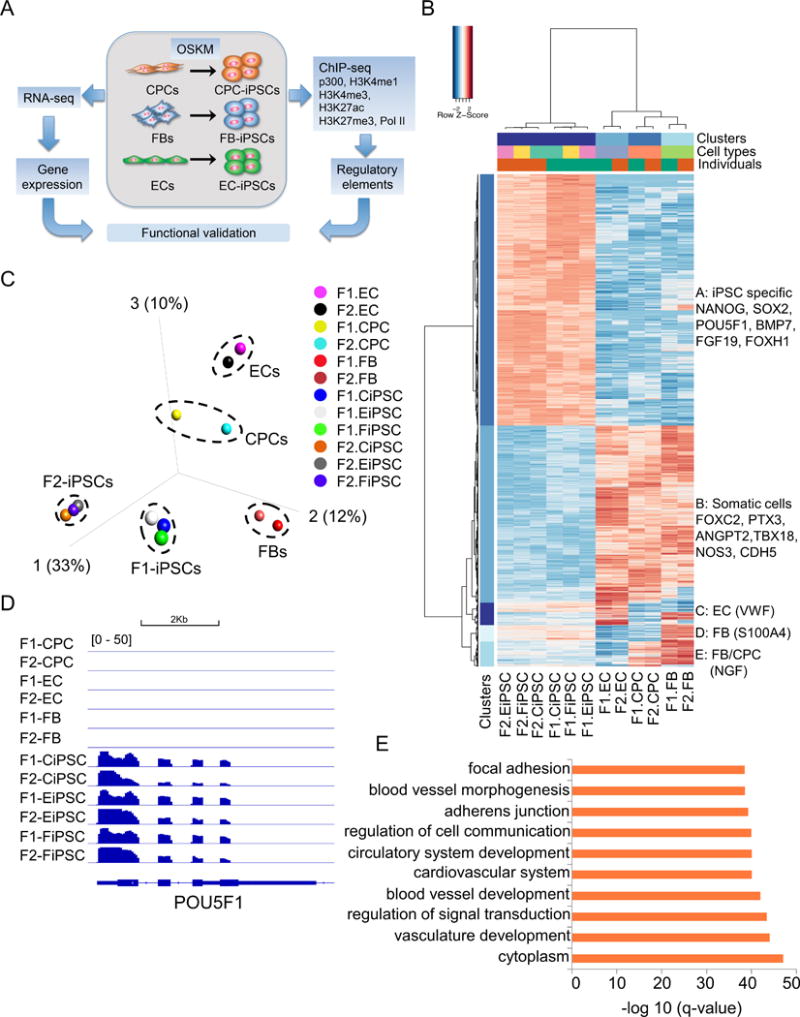
(A) Schematic diagram of overall experimental design in this study. (B) Unsupervised hierarchical clustering of 6,151 differentially expressed genes (DEGs) in human iPSCs and their parental somatic cells (q<0.0001). Cell type-specific gene expression patterns were classified into 5 clusters. Cluster A: iPSC signature genes (3,140); Cluster B: common genes highly expressed in somatic cells but not in iPSCs (2,213); Cluster C: EC-specific genes (279); Cluster D: FB-specific genes (205); Cluster E: genes highly expressed in both FBs and CPCs (314). (C) Principal component analysis (PCA) of somatic cells and their respective iPSCs according to global gene expression profiles. (D) POU5F1 was expressed in all iPSC lines but not in somatic cells. (E) Top enriched gene ontology (GO) terms associated with DECs between iPSCs and somatic cells.