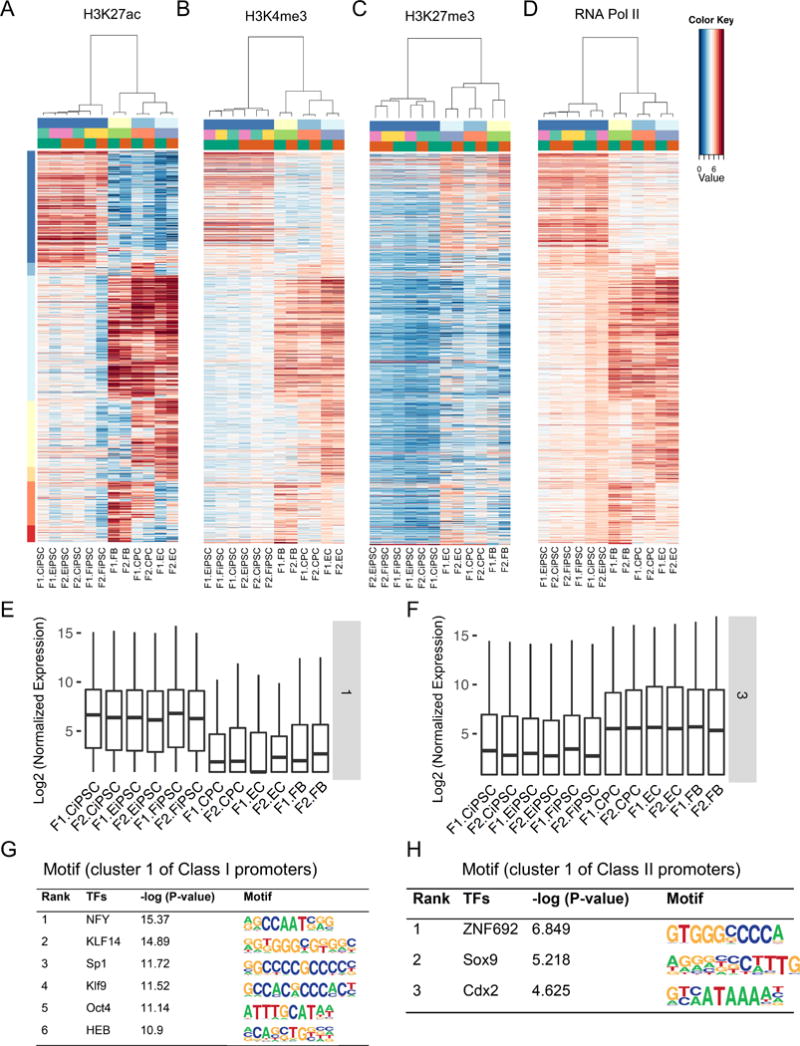
Figure 5. Cell type-specific H3K4me3 promoters and their influence on gene expression.

(A–B) Coordinated enrichment of H3K27ac and H3K4me3 distinguished different cell types by Class II promoters. (C) Negative correlation of repressive mark H3K27me3 in these regulatory regions. (D) RNA Pol II was positively correlated with the active histone mark H3K27ac. (E–F) Cell type-specific gene expression controlled by the Class II promoters. Cluster 1 genes were preferentially expressed in iPSCs whereas cluster 3 genes were highly expressed in somatic cells. (G–H) Differential top enriched TF binding motifs by cluster 1 (iPSC-specific) of Class I and Class II promoters.
