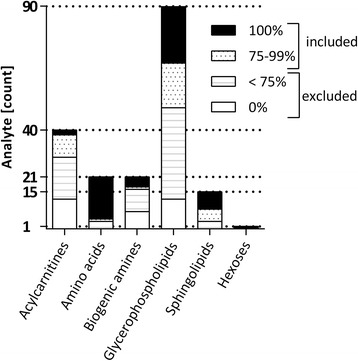
Fig. 1.

Detection efficiency of metabolites in CSF and selection for subsequent analyses. The number of detectable metabolites per analyte class is stated on the y-axis. Bars indicate the number of analytes in a given class detected >LOD in all samples according to four categories as indicated by the fill patterns: detected in all samples (“100%”), >75% of samples (“75–99%”), <75% of samples (“<75%”), and in none of the samples (“0%”). The 88 metabolites detected in 75–100% of all samples were used for subsequent analysis
