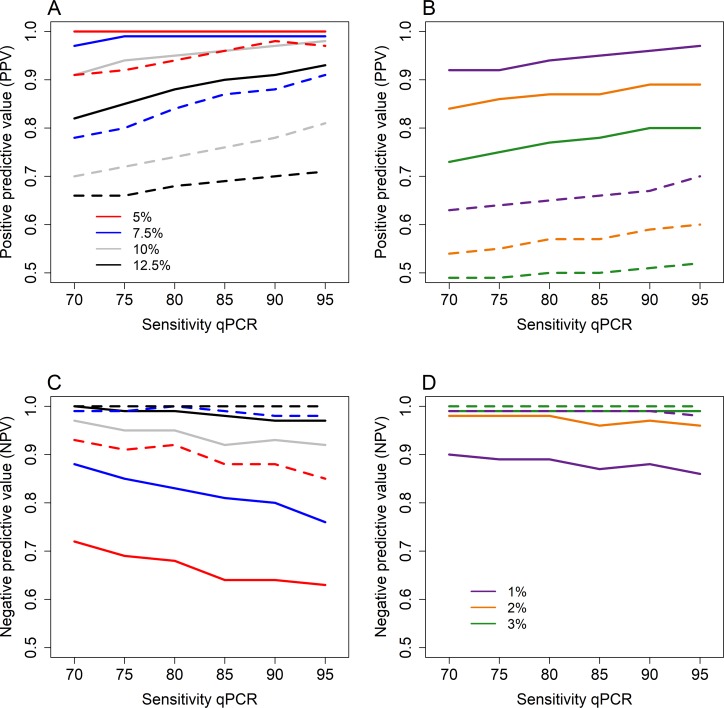
Fig 5.
Results of the sensitivity analysis of the sensitivity of qPCR, showing the positive predictive values for Ascaris (A) and hookworm (B); and the negative predictive values for Ascaris (C) and hookworm (D). The solid lines show the PPV/NPV results of qPCR and the dashes lines the results of KK. Results are shown for differing prevalence threshold levels, 5–12.5% for Ascaris and 1–3% for hookworm.

