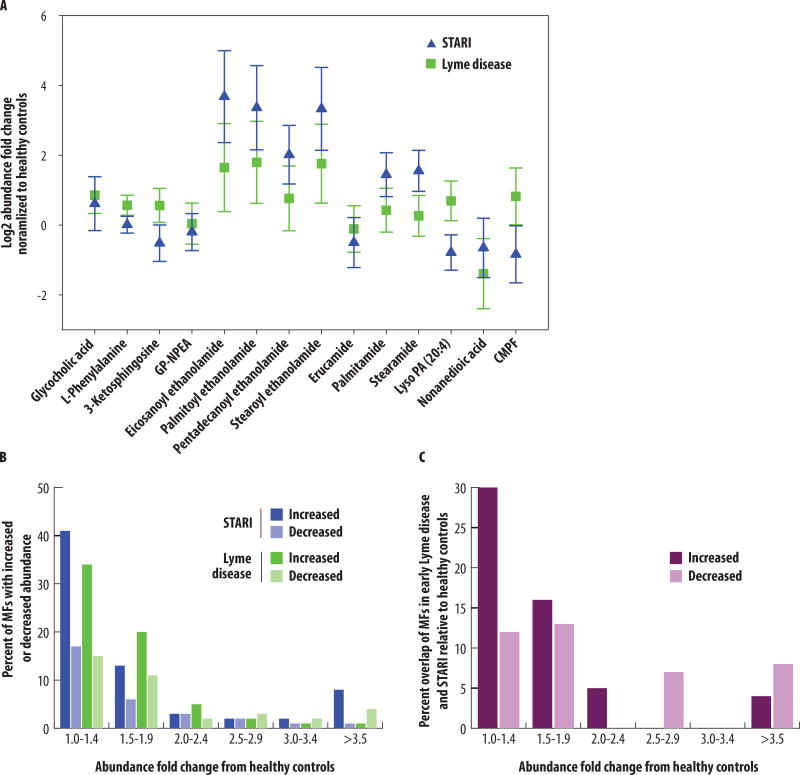
Fig. 4. Comparison of MF abundances from the Lyme disease-STARI biosignature against healthy controls.
(A) Fourteen of the metabolites with level 1 or level 2 structural identifications were evaluated for abundance differences between early Lyme disease (green squares) and STARI (blue triangles) normalized to the metabolite abundance in healthy controls. Included are metabolites identified for NAE and PFAM metabolism. GP-NAE: glycerophospho-N-palmitoyl ethanolamine; Lyso PA (20:4): arachidonoyl lysophosphatidic acid; CMPF: 3-carboxy-4-methyl-5-propyl-2-furanpropanoic acid. The relative mean abundance and 95% confidence intervals are shown for each metabolite. (B) Abundance fold change ranges (x-axis) plotted against the percent of MFs from the 261 MF early Lyme disease-STARI biosignature that have increased (dark blue) or decreased (light blue) abundances in STARI relative to healthy controls, and increased (dark green) or decreased (light green) abundances in early Lyme disease relative to healthy controls. (C) The percentage of identical MFs in STARI and early Lyme disease that had the same directional and similar abundance fold change difference relative to healthy controls (y-axis). MFs were grouped based on abundance fold change ranges:1.0–1.4, 1.5–1.9, 2.0–2.4, 2.5–2.9, 3.0–3.4, and ≥3.5 (x-axis). MFs with increased fold changes relative to healthy controls are indicated in dark purple or and those with a decreased fold changes are indicated in light purple.

