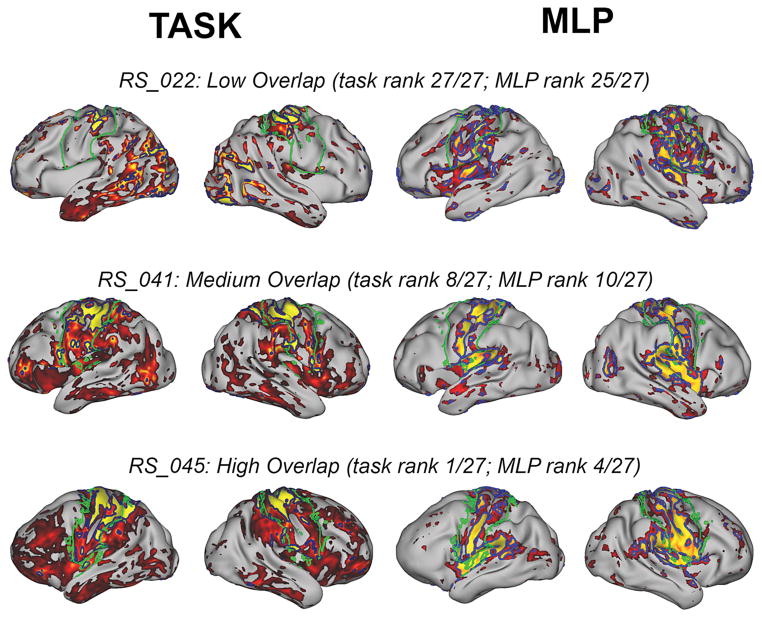
Figure 3.
Surface Views Across a Range of Jaccard Overlap Indices
Task activation maps (left) and MLP probability maps (right) are shown for subjects with low, medium, and high overlap with FS-SM on the patient’s native mesh inflated surface. Green borders delimit FS-SM ROI (left and right columns). Task (left columns): Dark blue borders encircle regions exceeding the task threshold with maximum overlap. Task maps are scaled to 2.7, the mean of max overlap thresholds across subjects. MLP (right columns): Blue borders encircle regions exceeding the MLP threshold with maximum overlap. MLP probability maps are scaled 0.7 to 1.0.

