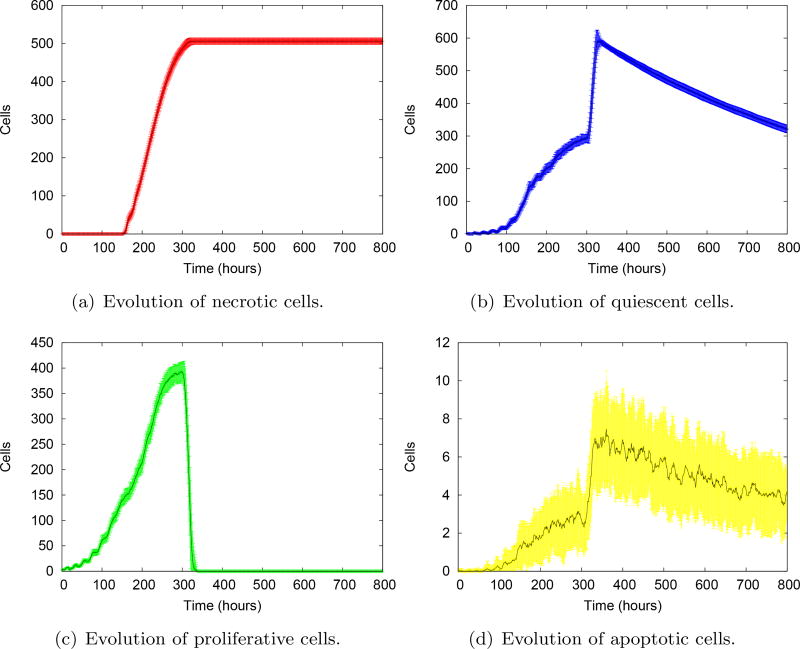
Fig. 16.
Evolution of the mean of individual cell phenotypes for ᾱP = 0.52. The shaded areas represent the standard deviations at each evolution time. These variabilities are remarkably smaller than those that emerge from the intracellular control (see Figure 14).

