
Fig. 1.
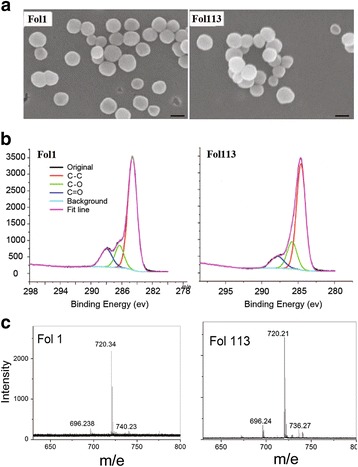
The physiochemical characterizations of fullerenols. a SEM images of NP aggregates (bar = 100 nm), b XPS data, c MALDI-TOF-MS data without a matrix
Official websites use .gov
A
.gov website belongs to an official
government organization in the United States.
Secure .gov websites use HTTPS
A lock (
) or https:// means you've safely
connected to the .gov website. Share sensitive
information only on official, secure websites.
The physiochemical characterizations of fullerenols. a SEM images of NP aggregates (bar = 100 nm), b XPS data, c MALDI-TOF-MS data without a matrix