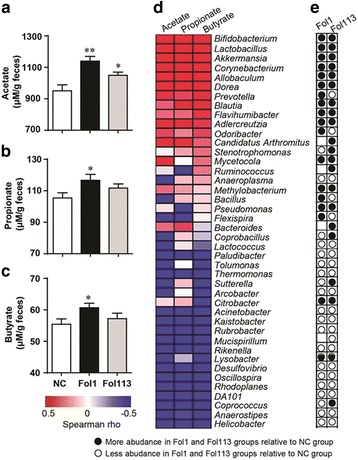
Fig. 5.

Fullerenol NPs alter SCFA fecal concentrations in mice. Levels of acetate (a), propionate (b), and butyrate (c) are shown. (d) Heatmap of correlations between metagenomics genera for fecal SCFA levels. (e) Influence of fullerenol NPs on the relative abundance of SCFA-related genera. White and black circles indicate decreased and increased OTUs, respectively, in the Fol1- and Fol113-treated groups compared to control. Blank indicates similar abundance between fullerenol-treated and control groups. *P < 0.05, **P < 0.01 vs NC
