
Fig. 5.
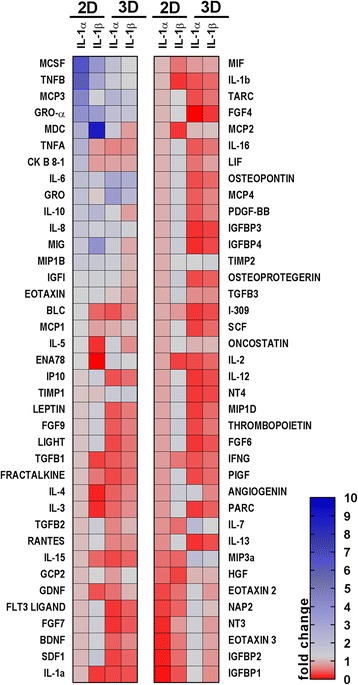
Heat map showing the cytokine concentrations secreted by MSCs cultured in two-dimensions (2D) and three dimensions (3D) after priming with IL-1α or IL-1β. Cytokines were analysed from the conditioned media of MSCs cultured in 2D and 3D, under untreated or primed conditions (IL-1α or IL-1β). Colours are assigned according to the relative scale of expression, ranging from 0 to 10, and representing fold-increase change versus the untreated condition