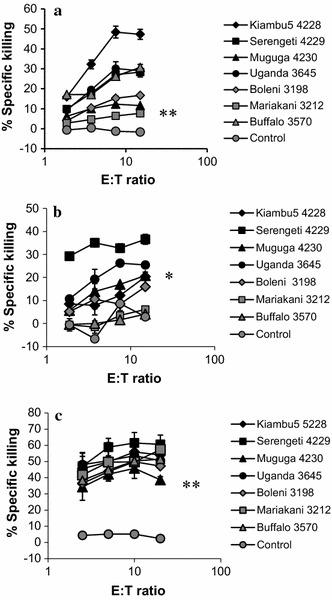
Fig. 1.

Strain-specific response by CTL generated in three A18+ animals. BE017 (a), BE033 (b) and BE043 (c). Seven infected cell lines were prepared from each animal as detailed in the Methods. The CTL lines from were tested at several effector:target (E:T) ratios as indicated. The experiment was performed twice with similar results. Significance compared to the PBMC control was tested with a T-test. *P < 0.05. **P < 0.01. a All P < 0.05; b buffalo and Mariakani were not significant different from PBMC, all other P < 0.05; c all P < 0.01
