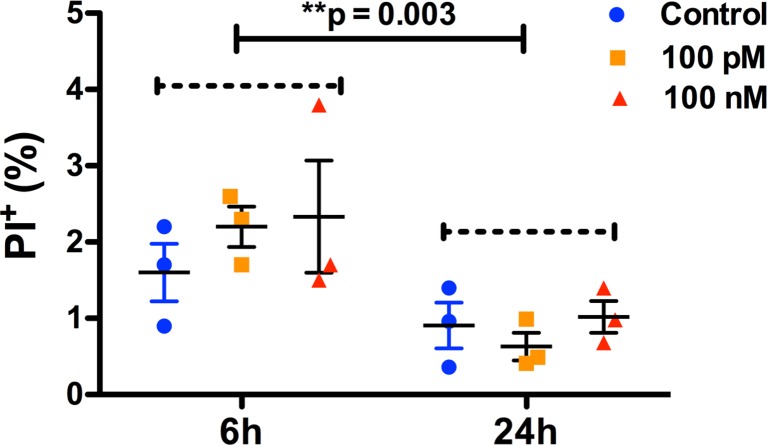
Fig 3. No difference in NPC death at the end of oxytocin treatment.
Scatter plots showing the proportion of dead NPCs after treament with either 0, 100 pM, or 100 nM oxytocin for either 6 or 24 h, as noted. NPC death was quantified with PI staining. 2-way ANOVA analysis did not show a difference either with oxytocin treatment (F (2,12) = 0.59, p = 0.58, η2 = 0.04) or a treatment*time interaction (F (2, 12) = 0.66, p = 0.53, η2 = 0.04). However, there was a significant effect of time (F (1, 12) = 14, *p = 0.003, η2 = 0.49) with a lower rate of NPC death at 24h compared to 6h. Data are expressed as mean ± S.E.M from three biologically independent NPC cultures.

