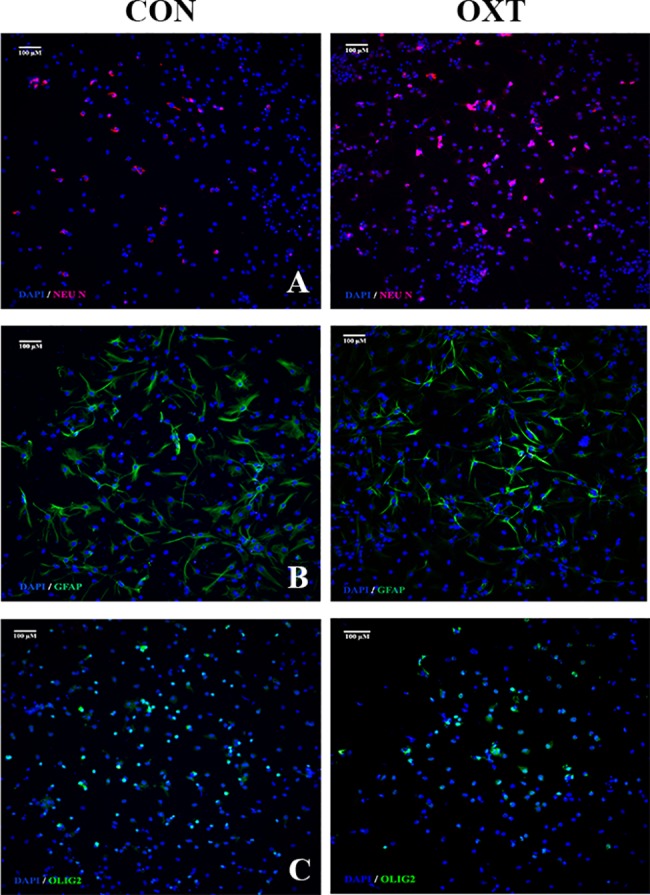
Fig 9. Representative photomicrographs of spontaneously differentiating NPCs after oxytocin exposure (100 nM).

A panel showing 10x photomicrographs of neuronal (A), astrocytic (B), and oligodendrocytic (C) differentiation as labeled by Neu N, GFAP, and Olig2, respectively, in control (left) and oxytocin (right) treated NPCs. Nuclei counterstained with DAPI. Scale bar as noted.
