. 2017 Dec 28;6:e31065. doi: 10.7554/eLife.31065

Figure 10. Inhibition of Fibronectin activity mimics the yap1;wwtr1 double mutant phenotype.

(A–C) Control embryo (A) and embryos injected with 400 pg fn∆C mRNA (B,C). (D, E) Control (D) and fn∆C-injected (E) embryos stained with phalloidin. Note the absence of chevron-shaped somites in panel E. (F, G) Control (F) and fn∆C-injected (G) embryos incubated with the anti-Tp63 antibody and co-stained with DAPI. Note the single layer of Tp63-positive presumptive epidermal cells in panel G (n = 12/12 embryos with a shortened tail had a single layered presumptive epidermis). All embryos are at the 24-somite stage with anterior to the left.

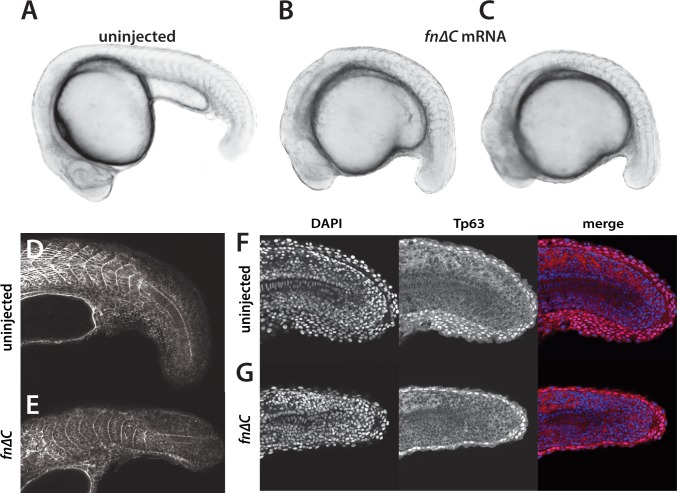
Figure 10.

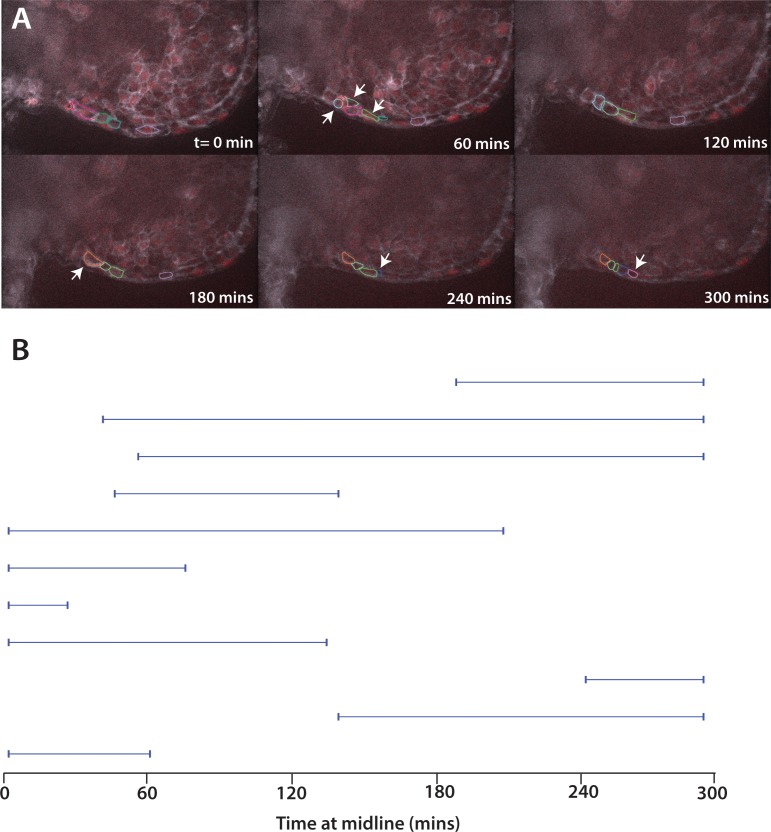
Figure 10—figure supplement 1. Movement of cells expressing Fn∆C.

Figure 10—figure supplement 1.

(A) Stills from live imaging of ventral fin fold formation in embryos expressing Fn∆C from injected mRNA. This movie is a representational movie of one of three movies. Arrowheads show new cells entering the fin fold. (B) The time individual Fn∆C expressing cells were at the midline measured in a single movie. Compare to wild-type cells in Figure 8A. Embryos were positioned on their side and filmed from the left side. When Fn∆C cells crossed over the midline to the right side of the embryo, we stopped recording them, resulting in a truncated line.