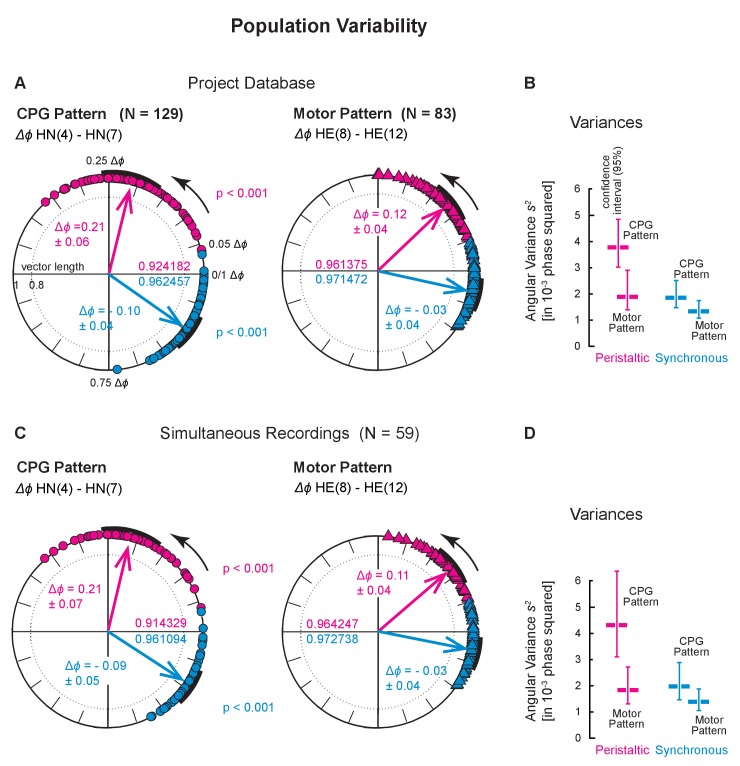
Figure 5. Population variability across two larger populations.
Population variances for the Project Database (Top) and for the Simultaneous Recordings from the HN interneurons and HE motor neurons (Bottom). (A) Variances across all preparations in the Project Database (Figure 2—figure supplement 1A). Each symbol on the circular phase plots represents the average intersegmental Δϕ of one preparation in one switch cycle. The number of preparations and the mean intersegmental Δϕ (±SD) is indicated for the CPG pattern (N = 129; circles) and of the motor pattern (N = 83, triangles) for peristaltic (magenta) and synchronous (blue) coordination. Thick arrows represent the average intersegmental Δϕ across preparations (values indicated for each level), their length the angular variance (values inside each circle), and the black arcs the angular standard deviation. Note that the intersegmental Δϕ of the CPG pattern is larger than that of the motor pattern (peristaltic: p<0.001, synchronous: p<0.001, unpaired t-test). (B) Angular variances and the confidence intervals of 10,000 bootstrapped populations (vertical lines) for the CPG pattern and the motor pattern. Note that confidence intervals (95%) do not overlap in the peristaltic coordination. (C) Variances across all Simultaneous Recordings (Figure 2—figure supplement 1B). Each symbol on the circular phase plot represents the average Δϕ of a preparation in which HN interneurons and HE motor neurons were simultaneously recorded. Layout, symbols and colors as in (A). Note that the average intersegmental Δϕ of the CPG pattern is larger than that of the motor pattern (peristaltic: p<0.001, synchronous: p<0.001, paired t-test). (D) Angular variances and their confidence intervals are shown for the CPG pattern and the motor pattern. Note that confidence intervals (95%) do not overlap in peristaltic coordination. Color code and labels as in (B).

