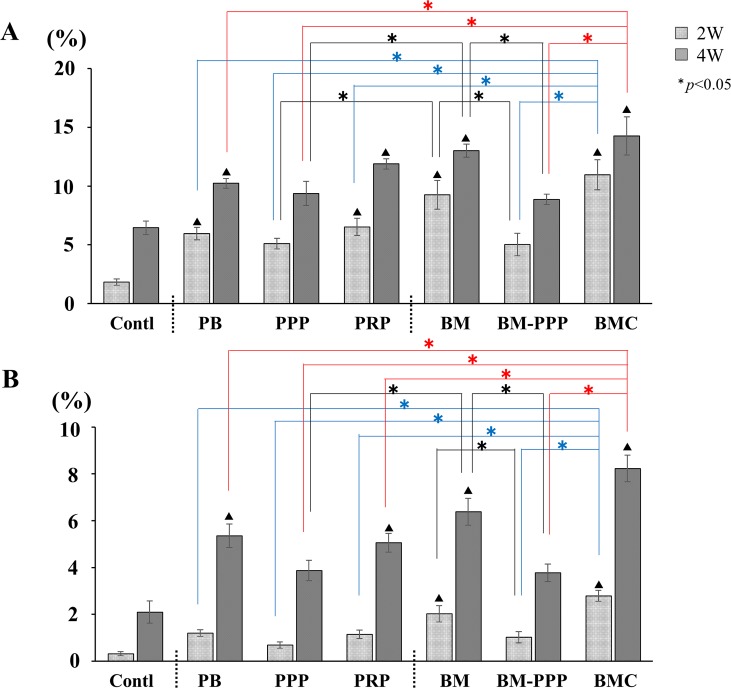
Fig 5.
Average area (%) of newly formed bone in the whole area (A) and at the surface of β-TCP particles (B). (A) At 2 weeks, BMC and BM groups showed considerable new bone formation, and the amount of new bone in the BM group was significantly increased compared to the Control, PB, PPP, PRP, and BM-PPP groups (p <0.05). At 4 weeks, bone formation was promoted in all groups. In particular, new bone area was obviously augmented in the BMC, BM, and PRP groups. (B) When the area of replaced bone tissue at the surface of β-TCP particles was assessed, BMC and BM groups showed significantly increased area compared to the Control group at 2 weeks (p <0.05). Then, the BMC group showed more prominent bone formation at 4 weeks. In particular, a significant difference was found between BMC and PRP groups. Values are the means ± standard deviations of five sections from each of the five specimens per group. The asterisk represents statistical significance (*p <0.05) among experimental groups, and the triangle-mark represents statistical significance (▲p <0.05) between the Control and other groups.

