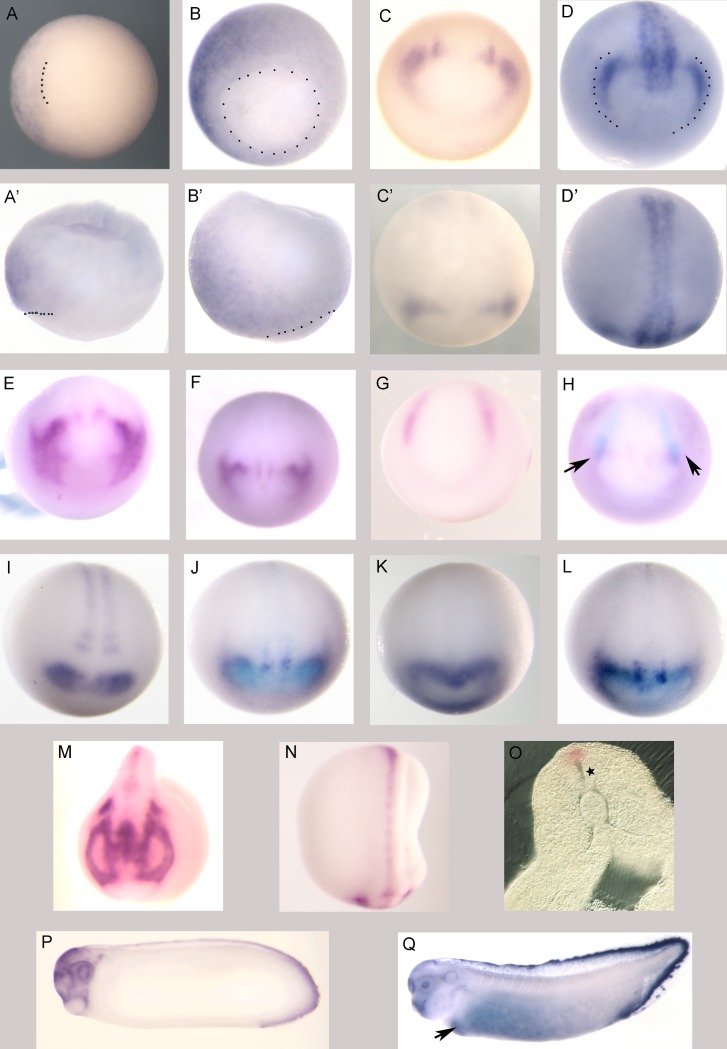
Fig 3. Spatial expression of apoCI mRNA.
Vegetal (A, B) and lateral (A’, B’) views of stage 10 (A, A’) and stage 11 (B, B’) embryos, respectively; apoCI transcript is localized to the dorsal ectoderm. Dotted lines in A, A’ mark the dorsal blastopore lip and dotted lines in B, B’ indicate the blastopore. Dorsal is to left in A, A’, B; dorsal is at 10 o’clock in B’. (C, D) Anterior views of apoCI expression in stage 13 and stage 15 embryos, respectively (dorsal to the top). Dotted line in D marks the pan-placodal primordium. (C’, D’) Dorsal views of embryos in C and D, respectively; anterior is down. (E) Anterior view of a stage 16 embryo; the anterior crescent of apoCI expression has expanded laterally. (F-L) Dorsoanterior views of stage 15 embryos; anterior is down and dorsal is to the top. (F) apoCI expression. (G) slug expression. (H) apoCI (purple) and slug (light blue) coexpression; arrows indicate region of overlap (cranial neural crest). (I) pax6 expression. (J) apoCI (purple) and pax6 (light blue) coexpression. (K) otxA expression. (L) apoCI (purple) and otxA (light blue) coexpression. (M, N) Anterior (M, dorsal is to the top) and dorsal (N, anterior is down) views showing apoCI expression in a stage 21 embryo. (O) Transverse section revealing expression of apoCI in the dorsal neural tube at stage 22; star indicates the neural tube. (P, Q) Lateral views of apoCI expression in stage 27 and stage 33 embryos, respectively; anterior is to the left. Arrow in Q marks liver primordium. No signal was detected with an apoCI sense strand probe (data not shown).

