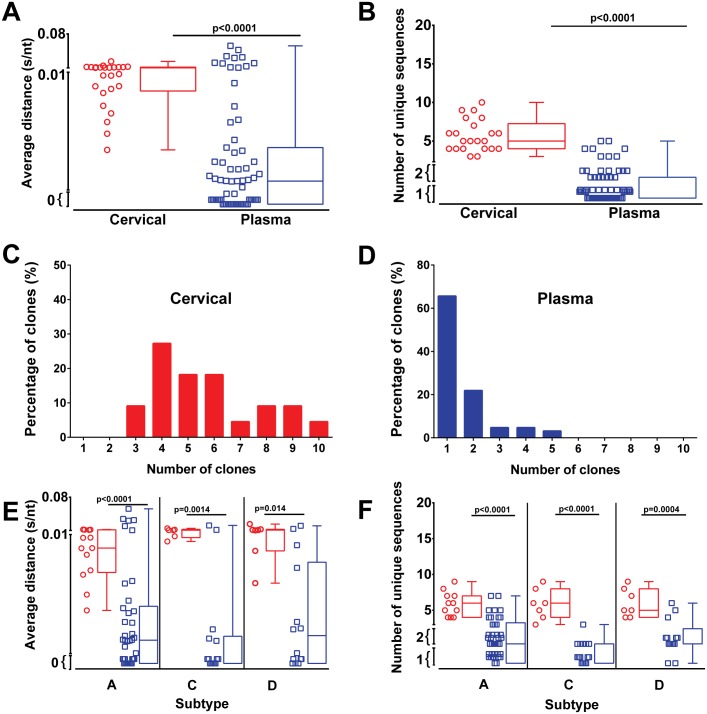
Fig 2. Higher HIV-1 diversity in the female genital tract than in blood within 7 months of infection.
The HIV-1 C2-V3-C3 env region present in cervical (red symbols and red boxplot) and plasma (blue symbols and blue boxplot) samples were PCR amplified and analysed by NGS. The average p-distance (s/nt) of HIV sequences within C2-V3-C3 region were calculated using MEGA 6 with sequences below 200bp excluded from analysis (A). The number of unique sequences within each sample were identified using online Galaxy software to collapse all sequence reads for each sample (B). Frequency of clones in cervical (C) and plasma samples (D) were determined from the number of unique clones. Average distance (E) and the number of unique sequences (F) in cervical and plasma samples grouped by subtype of infection. Analysis of significance was done using a two-tailed Mann-Whitney test. Each symbol represents an individual subject.

