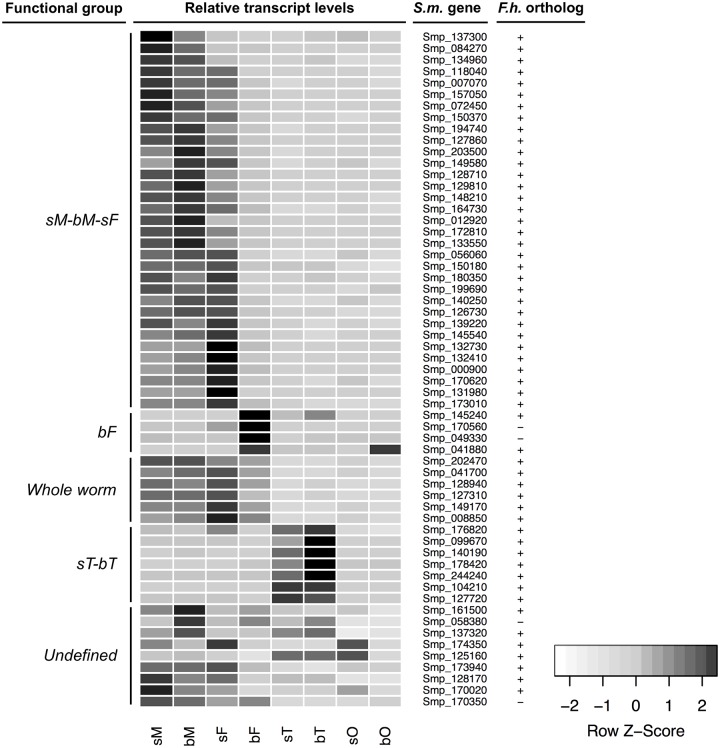
Fig 2. Hierarchical clustering of GPCR genes expressed in adult S. mansoni.
Shown are functional groups to which GPCRs were assigned according to their relative transcript levels in adult S. mansoni obtained by a recent RNA-seq study from Lu et al. [32]. The heat map shows relative gene expression in all samples, which was calculated by the Z-score method implemented in the heatmap.2 function of the gplots package. Darker color indicates higher expression across all samples, and lighter color indicates lower expression levels (Color Key). The sM-bM-sF group contains GPCR genes with a transcription bias towards males and pairing-inexperienced females, while the “whole worm” group displays a balanced transcription rate among both sexes independently of pairing. Instead of this, the bF and sT-bT groups contain GPCRs that are preferentially transcribed in reproductive organs, namely testis, ovary, or vitellarium. S.m. gene provides Smp numbers for the listed GPCRs of S. mansoni. Existing/missing orthologs in F. hepatica (F. h.) are indicated by +/- (see S1 Table for details). sM, pairing-inexperienced (single-sex) males; bM, pairing-experienced (bisex) males; sF, pairing-inexperienced (single-sex) females; bF, pairing-experienced (bisex) females; sT, testes from sM; bT, testes from bM; sO, ovaries from sF; bO, ovaries from bF.

