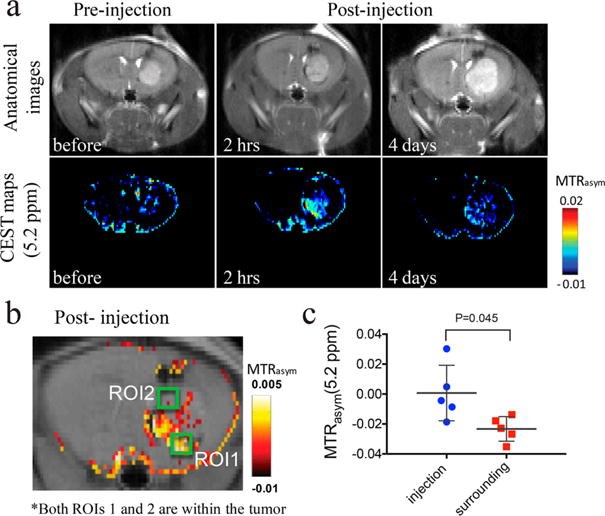
Figure 4.

MRI detection of a PemFE nanofiber hydrogel that was stereotactically injected in mouse brain tumors (day 25 after tumor implantation). (a) On the top, MRI images showing GL261 brain tumor at different time points (with respect to the time of injection of the nanofiber hydrogel); on the bottom, CEST maps at 5.2 ppm of the mouse brain before, and 2 h and 4 days after PemFE injection. (b) Illustration of chosen ROIs on overlaid CEST images at 2 h after the PemFE hydrogel injection to represent tumor regions of ROI1 (the PemFE injection site with increased CEST contrast) and ROI2 (its surrounding region, without CEST contrast). (c) Quantification of CEST contrast showing a significantly higher MTRasym value for the PemFE injection site than surrounding tumor (P > 0.05, two-tailed, paired Student’s t-test, n = 5).
