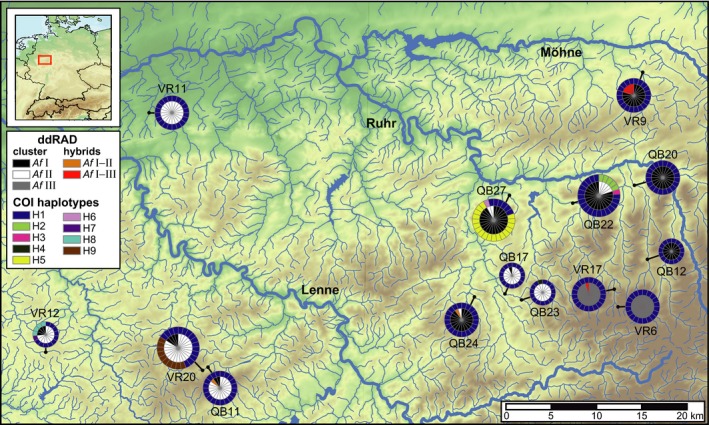
Figure 1.

Map of Sauerland region showing COI haplotype composition (outer circle) and ddRAD cluster assignment (inner circle) for individuals of Ancylus fluviatilis at the different sampling sites. The size of pie charts is scaled according to the number of analyzed specimens. The red box in the small map in the upper right corner indicates the location of the study area
