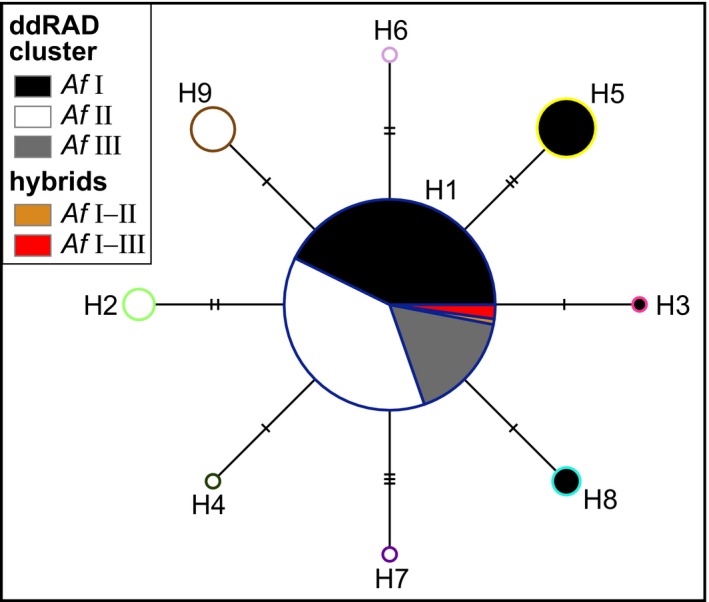
Figure 2.

Median‐joining network of COI sequences. The size of circles is scaled according to number of specimens showing the respective haplotype. Small dashes on connecting branches indicate number of differences between haplotypes. Haplotypes are colored according to ddRAD clusters and frame color corresponds with color of haplotypes in Figure 1
