
Figure 2.
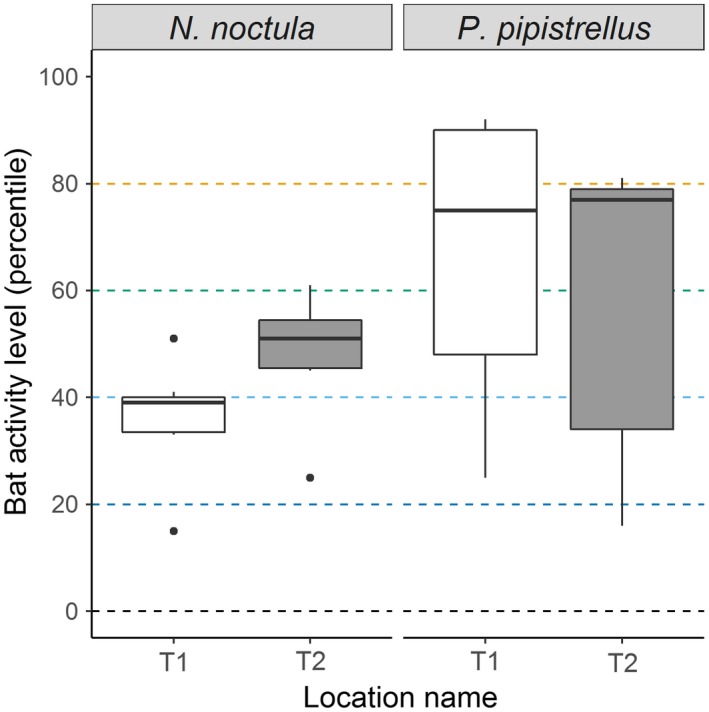
Differences in bat activity between static detectors. The center line indicates the median activity level, whereas the box represents the interquartile range (the spread of the middle 50% of nights of activity). Dashed lines indicate thresholds of bat activity categories (i.e., low activity 0–20th percentiles, low‐to‐moderate activity: 21st–40th percentiles)