
Figure 3.
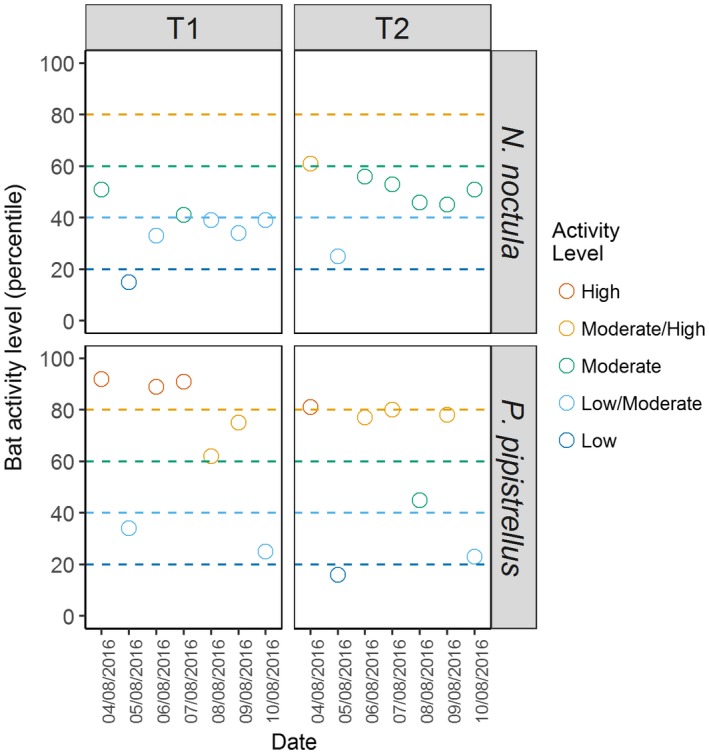
The activity level (percentile) of bats recorded across each night of the bat survey, split by location (here, T1 and T2) and by species
Official websites use .gov
A
.gov website belongs to an official
government organization in the United States.
Secure .gov websites use HTTPS
A lock (
) or https:// means you've safely
connected to the .gov website. Share sensitive
information only on official, secure websites.
The activity level (percentile) of bats recorded across each night of the bat survey, split by location (here, T1 and T2) and by species