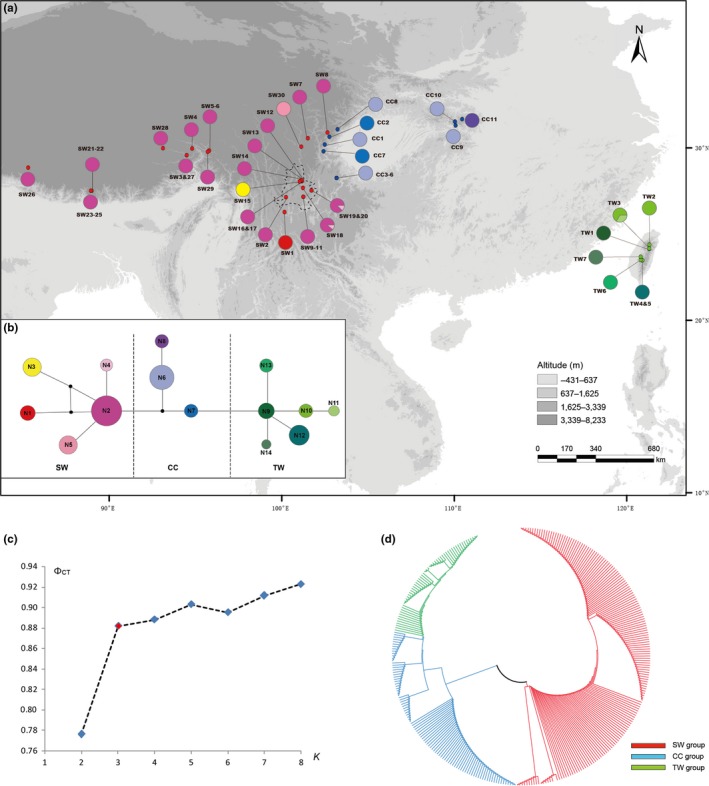
Figure 2.

Analysis based on ITS dataset. (a) Geographical distribution of haplotypes in Triplostegia (see Table S1 for population codes); (b) network of genealogical relationships between 14 haplotypes. Each circle represents a single haplotype sized in proportion to its frequency. Black dots in the network represent missing haplotypes; (c) results of SAMOVA (the red point indicated the optimized number of groups K); and (d) neighbor‐joining tree without out‐group. Potential interglacial refugia recognized by this study are encircled by dashed lines
