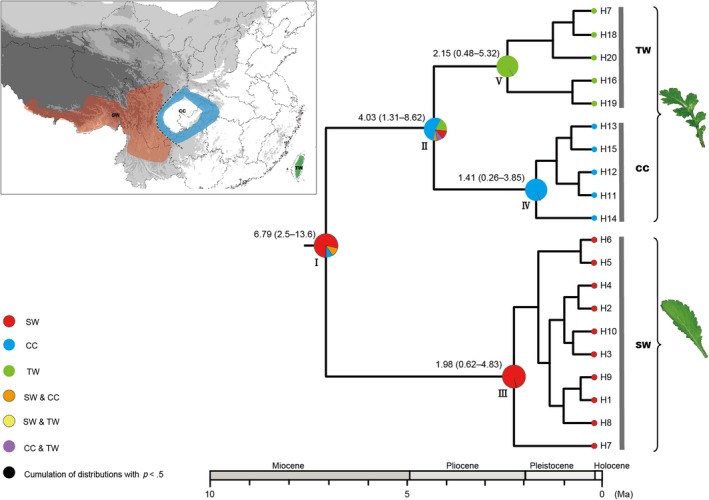
Figure 4.

Ancestral area reconstructions based on the Bayesian binary Markov chain Monte Carlo (BBM) method implemented in RASP using the BEAST‐derived chronogram of Triplostegia. The upper left map shows major distribution divisions of Triplostegia in China: southwestern (SW), Central (CC), and Taiwan (TW). Pie chart at each node illustrates the marginal probabilities for each alternative ancestral area derived from BBM with the maximum area number set to three. The legend denotes possible ancestral ranges at different nodes. Ages of key nodes are labeled above branches. The out‐group (Dipsacus asper, see Figure S5) was not shown here
