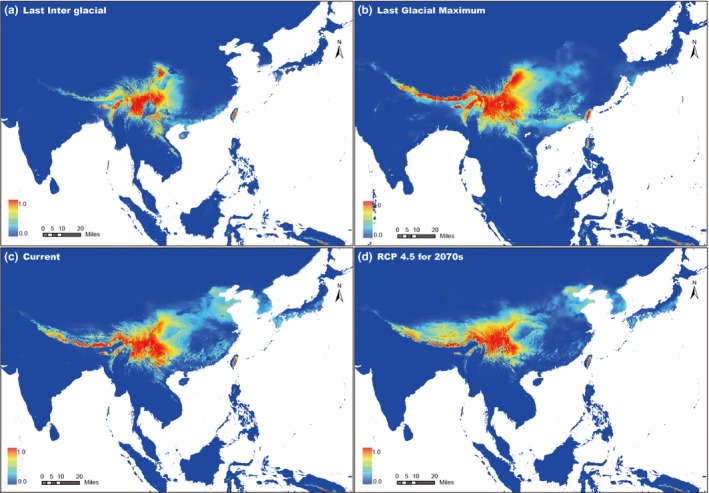
Figure 5.

Species distribution models showing climatic suitability for Triplostegia in East Asia: (a) the Last interglacial (LIG; 0.12–0.14 Ma); (b) the Last Glacial Maximum (LGM; 0.021 Ma); (c) current conditions (current, 1960–1990); and (d) 2070s (2061–2080) with the representative concentration pathways (RCP) of 4.5. Climatic suitability increases with color from blue to red. Resolution for the potential distribution map is 2.5 arc‐minutes
