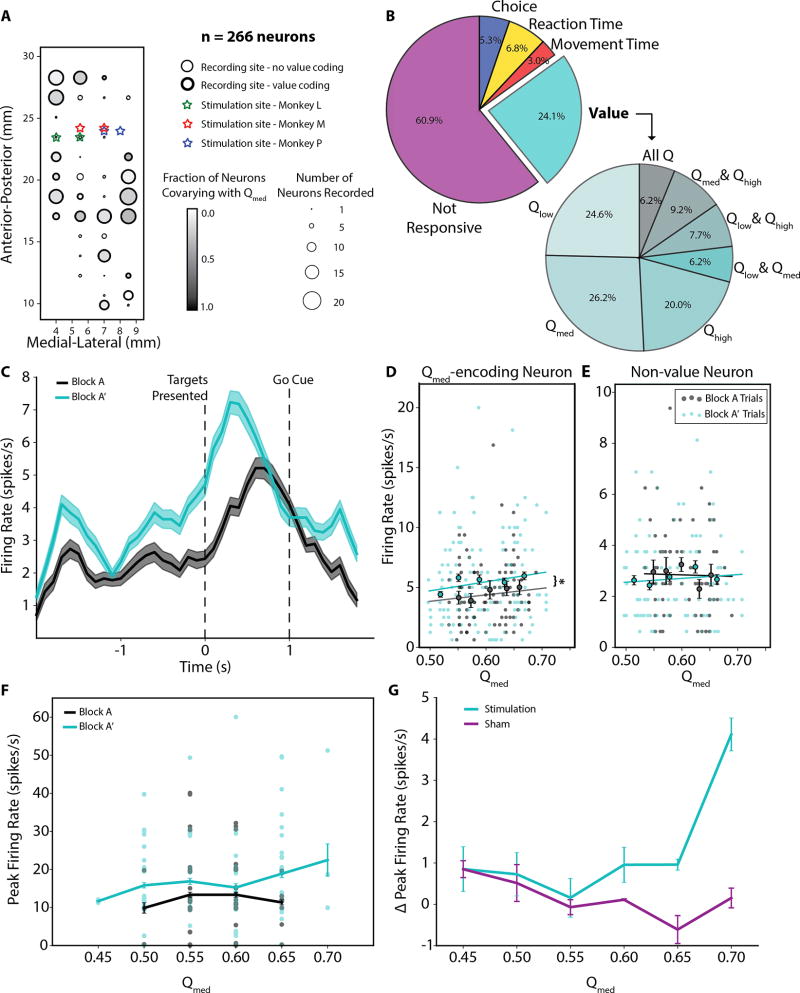
Figure 4. Neural correlates of value changes.
(A) Recording locations for Monkey M and stimulation locations for all subjects. A totally of 266 task-related caudate neurons were recorded. Medial-lateral coordinate values are presented from midline, while Anterior-Posterior coordinates are presented relative to the interaural line. The marker size indicates the number of neurons sampled per site, while the marker outline indicates if any neuron recorded at the location significantly co-varied with stimulus value. The shading of the marker indicates the proportion of neurons that particularly co-varied with the value Qmed. (B) Pie chart on left shows the neurons (n = 266) categorized into five main types based on the linear regression analysis. The pie chart on the right expands upon the number of Value neurons to demonstrate the frequency in which neurons were responsive to three different values, Qlow, Qmed, and Qhigh, and combinations thereof. (C) Average firing rate of a representative Qmed-value coding caudate neuron during Blocks A and A’. Activity is taken only from trials in which Qmed was associated with the lower-value target, i.e. when the medium-value and high-value targets were presented together. Only the last 100 trials in Block A, after initial learning, are considered so that firing rate changes are not dominated by effects of learning. (D) The firing rate during picture onset as a function of the modeled value Qmed is shown for the same representative neuron. Each marker represents the per trial firing rate in the window [0,400) ms from when the targets are presented, while the lines represent the linear fit of firing rate as a function of value given by the linear regression. The slopes of the linear regression fits were not significantly different (mBlock A = 6.279, mBlock A’ = 8.573, t-value = 1.263, p = 0.21), but there was a significant difference of 0.962 in the y-intercept (t-value = 2.213, p = 0.028). This suggests that there is a significant increase in firing rate during Block A’ for all Q-values. Circles with error bars represent the trial-averaged firing rates for each of 5 equally populated stimulus value bins. Again, only the last 100 trials in Block A are used for comparison so that firing rate changes are not dominated by effects of learning. (E) Similar data as shown in Figure 2D for a representative non-value coding neuron from the same recording session. The linear regression coefficients were not significant (p > 0.05 for both blocks), indicating firing rate was not significantly modulated by stimulus value in either block. (F) The peak firing rate during picture onset as a function of the modeled value is shown for the same representative stimulus value-coding neuron for Blocks A (late trials only) and A’. (G) The difference in peak firing rate between Blocks A’ and A averaged across all value-coding neurons (n = 64). The peak firing rate was taken from the window [0,400) ms from target presentation. Only the last 100 trials in Block A are used for comparison so that firing rate changes are not dominated by effects of learning. A two-way ANOVA finds that there are significant main effects (stimulation condition: F1,69 = 4.17, p < 0.05; stimulus value: F5,69 = 2.53, p < 0.05), as well as a significant interaction effect between stimulation condition and value (F5,69 = 4.98, p < 0.01).

